- Carbon Finance
- Posts
- 🧘♀️ Lululemon: The Pullback Fits
🧘♀️ Lululemon: The Pullback Fits

Investment Research Report: Lululemon Athletica Inc.
📅 Date: 07/13/2025
Investing is a game of conviction, and conviction is built on clarity. My research is an attempt to distill my thoughts, challenge my assumptions, and refine my decision-making. It is not a display of expertise, but a foundation, one that will evolve over time. My goal is simple: to become a sharper, more disciplined investor. If you take away even a single insight from this, then it has served its purpose. Feedback is always welcome. After all, the best investors never stop learning.
Note: This report is for informational purposes only and does not constitute investment advice; please refer to the full disclaimer at the end.
1. Investment Thesis in One Sentence
Lululemon is a high-quality, capital-efficient brand facing cyclical headwinds, giving investors a chance to finally own the premium business at a fair value.
2. Business Snapshot
Overview:
Lululemon is a leading athletic apparel and accessories brand for both women and men.
The company is best known for pioneering the athleisure trend, which is clothing designed for both workouts and everyday wear.
While it remains very popular in the U.S. and Canada and continues to expand in these markets, Lululemon is also focused on accelerating its global footprint.
General Information:
Ticker: $LULU
Sector: Textiles, Apparel and Luxury Goods
Year Founded: 1998
CEO: Calvin McDonald
Market Cap: $28B
Current Price: $237
Overall Revenue Growth:
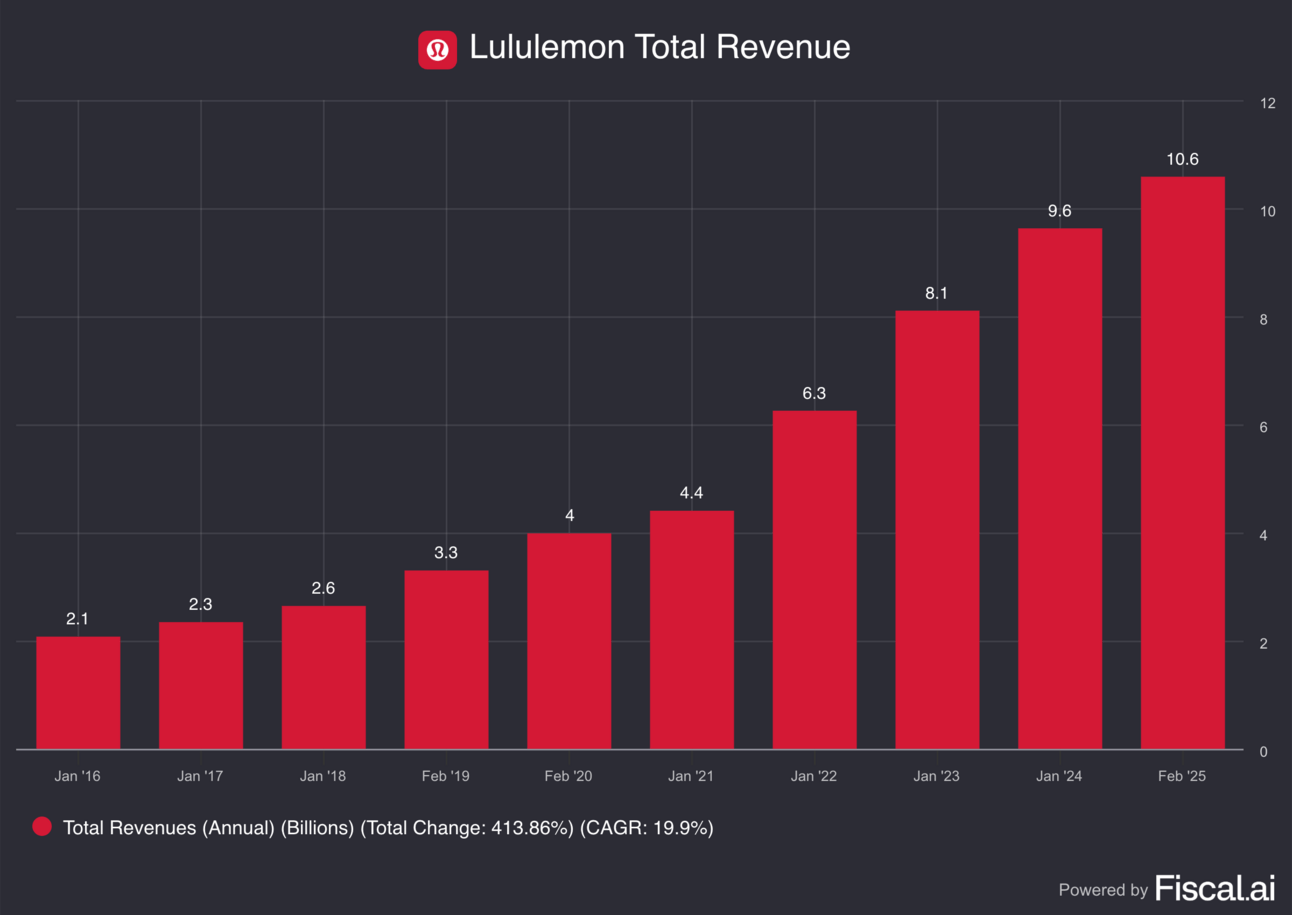
Since 2016, Lululemon has grown revenue at an impressive 20% CAGR.
While growth has slowed recently, the company still delivered 10% revenue growth last year.
Revenue by Segments:
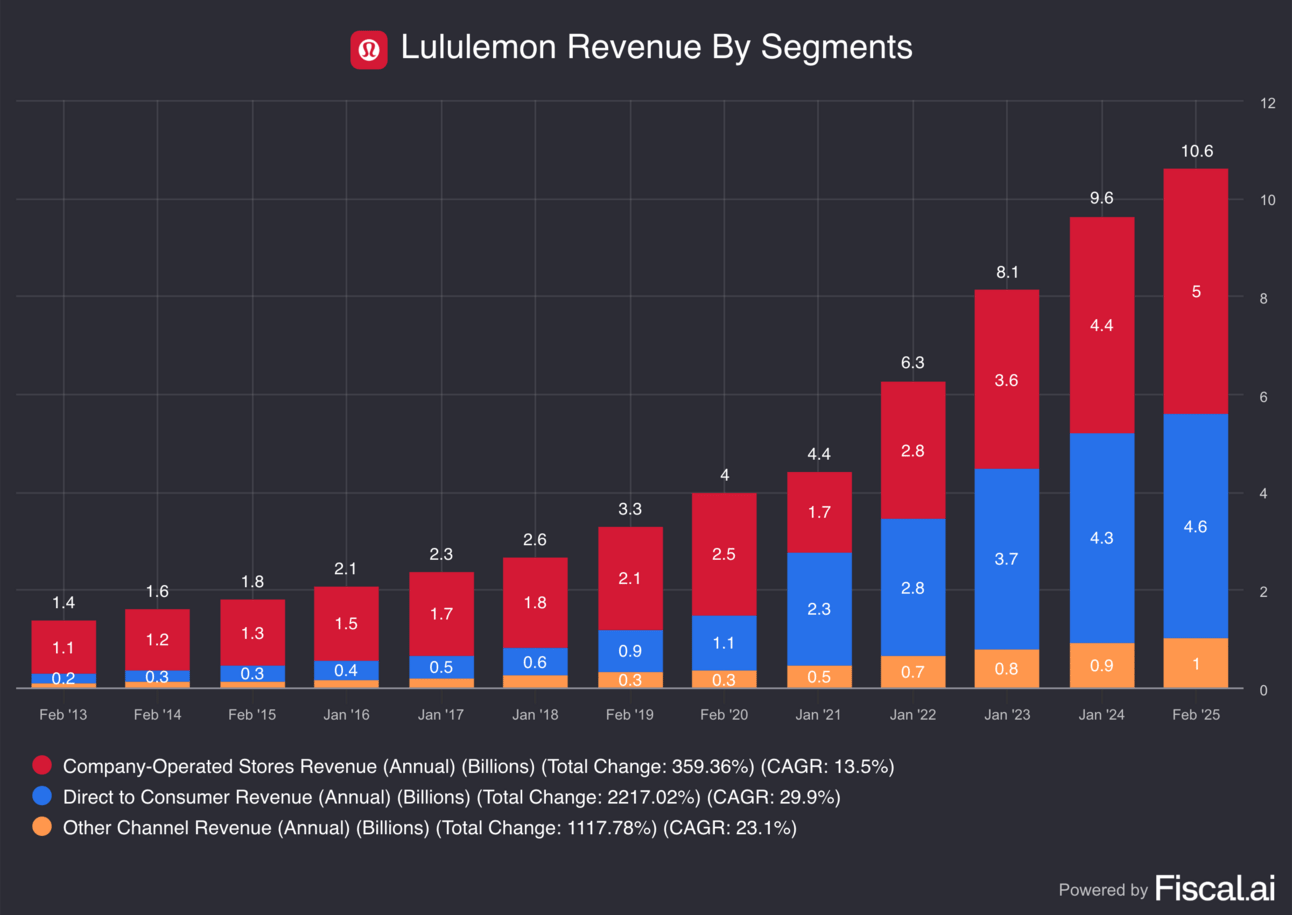
Lululemon generates revenue from two core channels: company-operated stores and direct-to-consumer (DTC).
While both contribute nearly equally today, DTC has been the faster-growing segment, expanding at 30%.
This represents more than double the growth of physical stores.
Revenue by Geography:
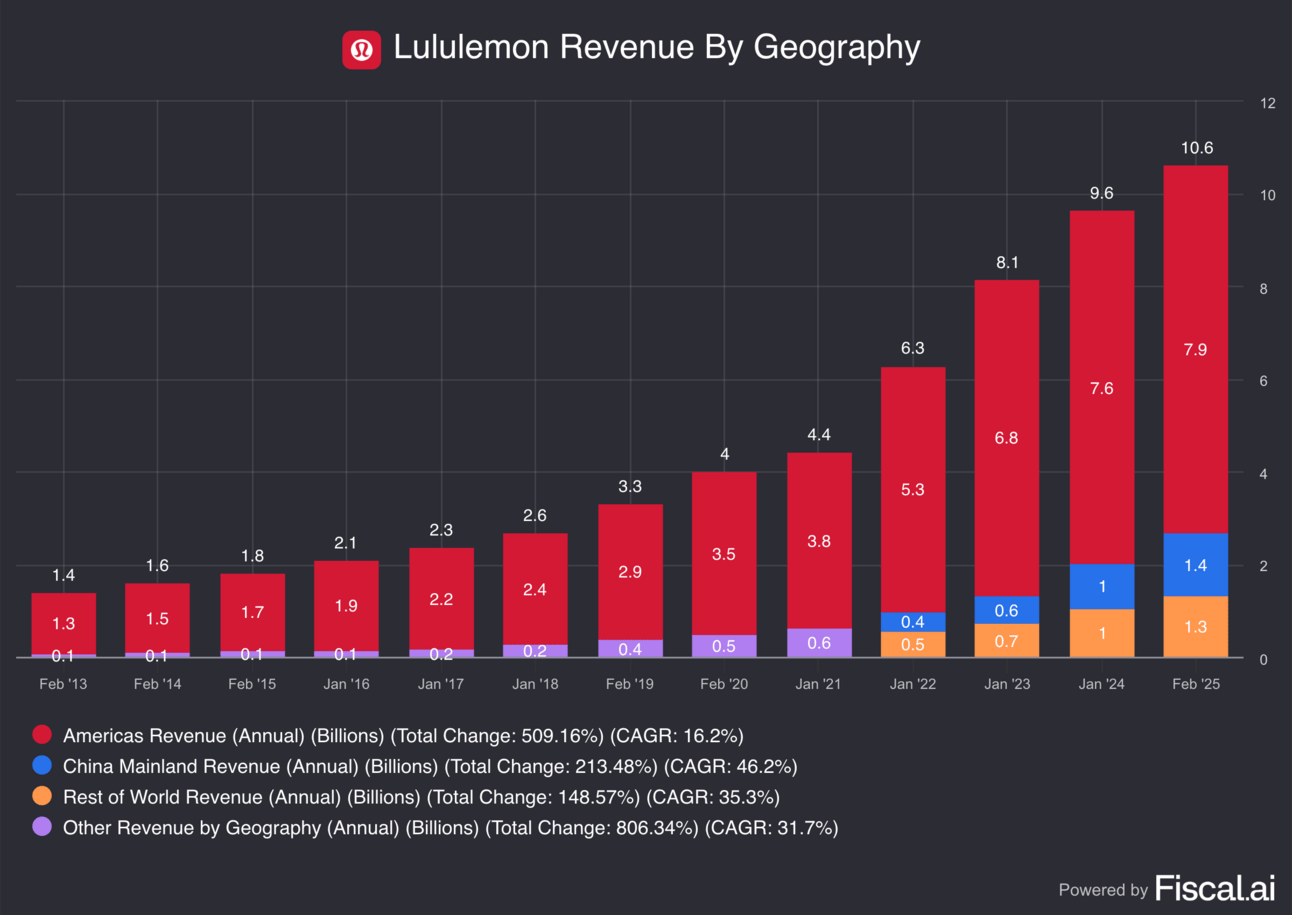
Roughly 75% of Lululemon’s revenue still comes from the Americas.
However, growth is slowing in the region, with just a 4% YoY increase.
In contrast, international growth remains strong. China and Rest of World grew 41% and 27% YoY, respectively.
Revenue by Gender:
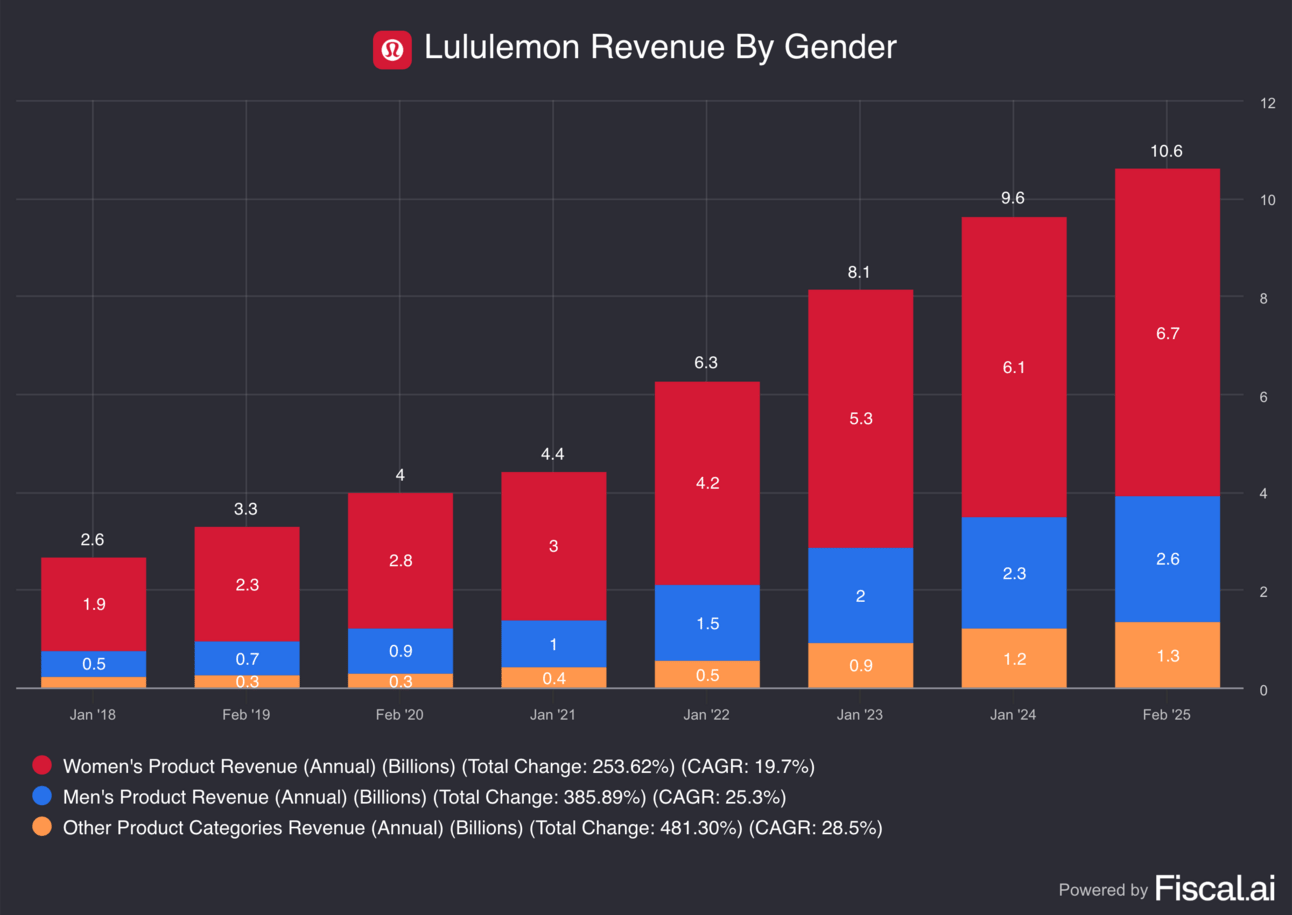
Women’s products account for 63% of revenue, while men’s products make up 25%.
This highlights Lululemon’s dominance among female consumers, but also leaves room for growth in the men’s category.
Diluted EPS:
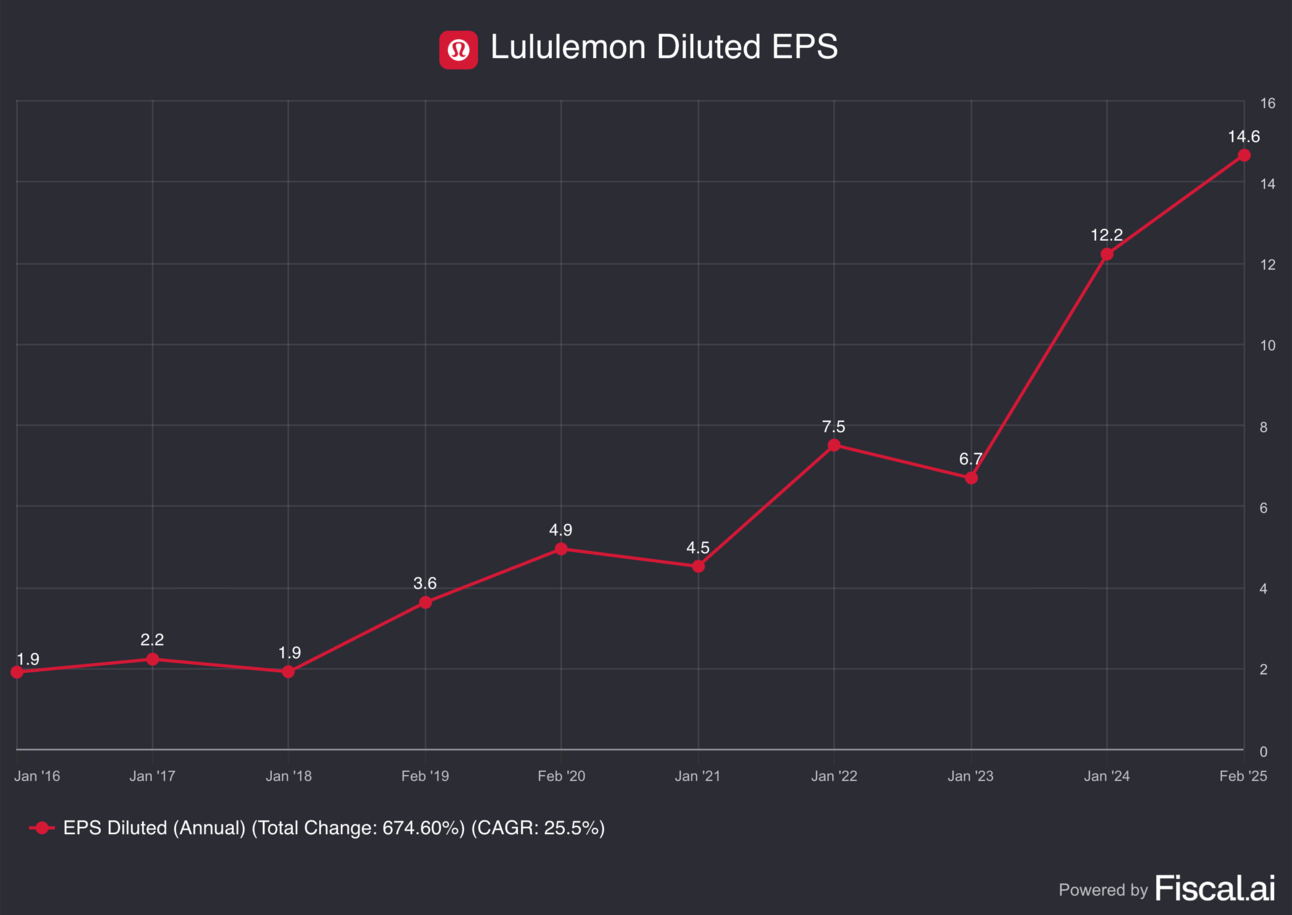
Lululemon has consistently compounded earnings, growing diluted EPS at a 26% CAGR since 2016.
Even with a recent slowdown in revenue growth, EPS rose 20% last year to $14.60.
Free Cash Flow:
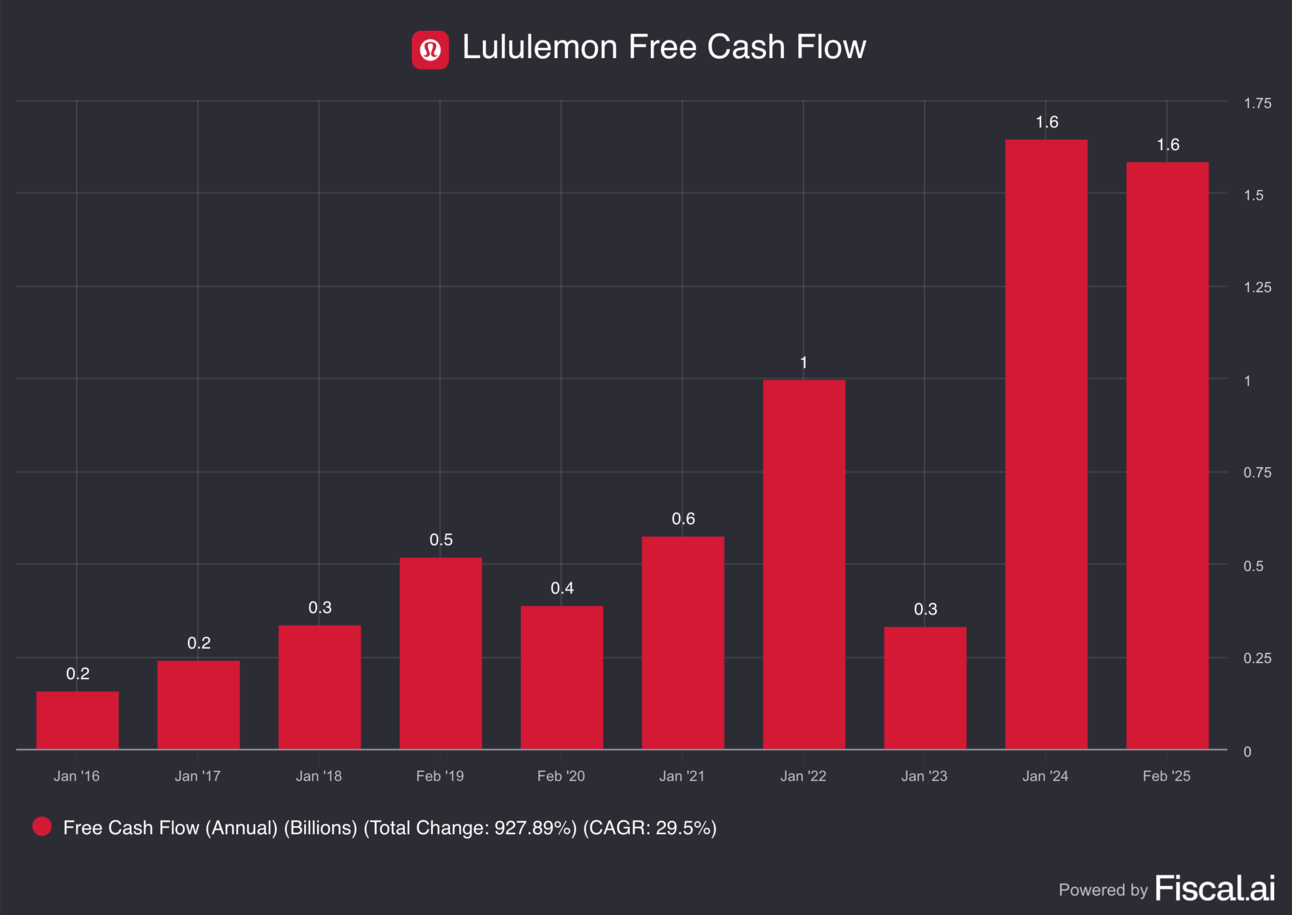
The company has also seen strong free cash flow generation, producing $1.6B over the past two years.
That said, free cash flow was considerably negative in the most recent quarter (Q1 2025), coming in at -$0.3B.
However, this isn't unusual.
Lululemon has reported negative free cash flow in every Q1 since 2019, except for 2021, with the bulk of its free cash flow typically generated in Q4.
This seasonal dip is typical for Lululemon, as Q1 often reflects inventory builds and CapEx spends ahead of stronger cash flow generation in Q4.
3. Context
On December 29, 2023, Lululemon shares peaked at $511.
Since then, the stock has plunged 54% to $237.
Over the past five years, Lululemon is down 25%, while the S&P 500 is up 94%.
This isn’t the first time the stock has tumbled and rebounded.
Lululemon has seen multiple 50–70% rallies followed by sharp pullbacks.
In 2025 alone, shares are down 36%.
So what’s driving this recent decline?
1/ Slowing North American Growth & Guidance Cut
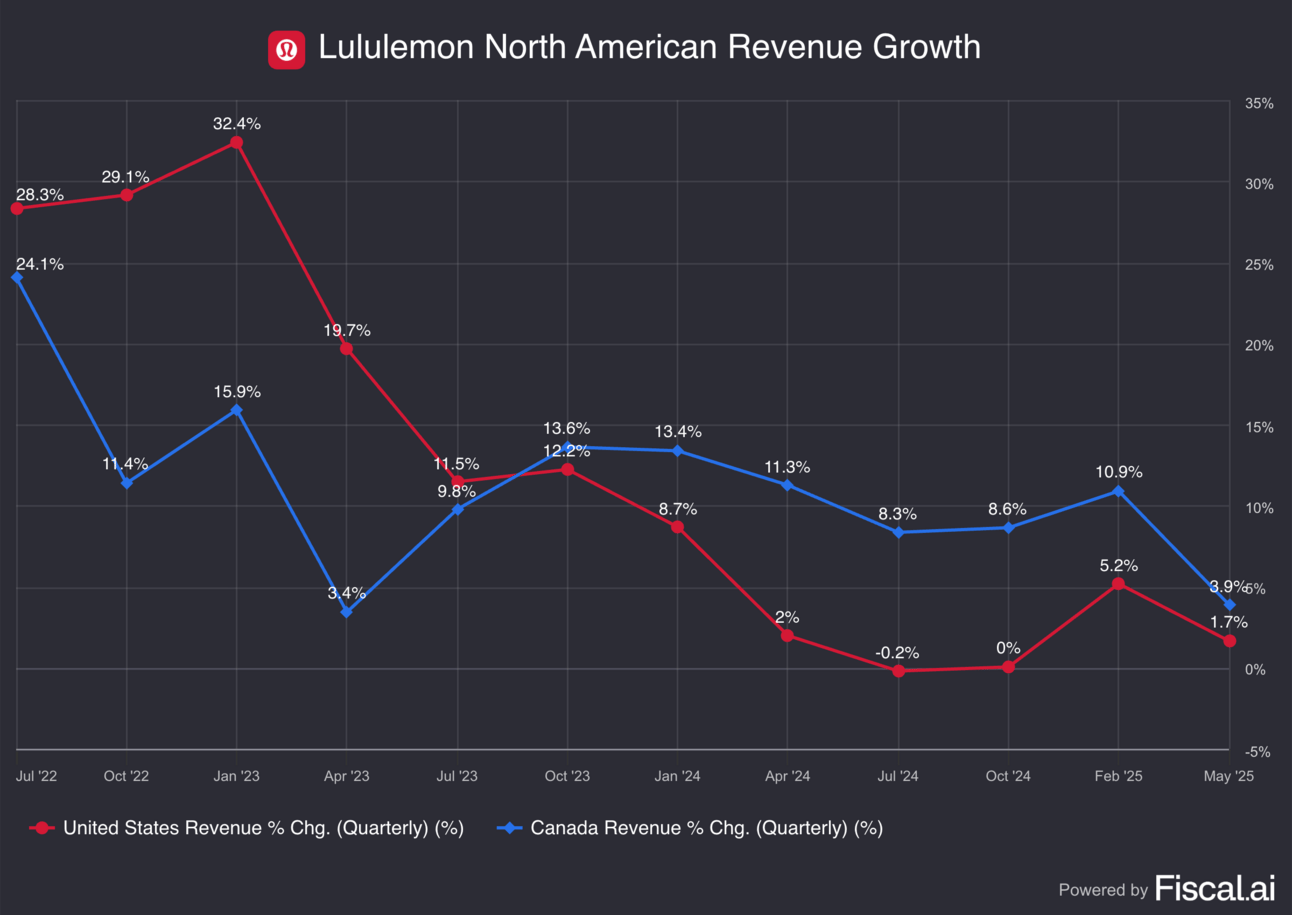
Lululemon’s most important market is losing steam.
In the latest quarter, U.S. revenue rose just under 2%, and Canada just under 4%.
This slowdown began in early 2024 and hasn’t reversed.
Growth was flat in both the July and October 2024 quarters.
On the most recent earnings call, management noted store traffic in North America continues to decline and doesn't expect improvement in Q2.
That said, average dollars spent per transaction did increase slightly.
CEO Calvin McDonald also cited a cautious consumer:
“Consumers remain cautious right now and they are being very intentional about their buying decisions.”
Lululemon also cut its full-year EPS forecast to $14.68 (midpoint), down from $15.05, citing macro uncertainty, cautious spending, tariffs, and increased competition.
2/ Tough Macro Environment
Lululemon faces headwinds on three fronts: tariffs, weak retail trends, and high interest rates.
According to its 2024 annual report:
40% of products are made in Vietnam, 17% in Cambodia, and others across Asia.
28% of its fabric comes from China Mainland.
While its supply chain is diversified, many key partners are affected by tariff risk.
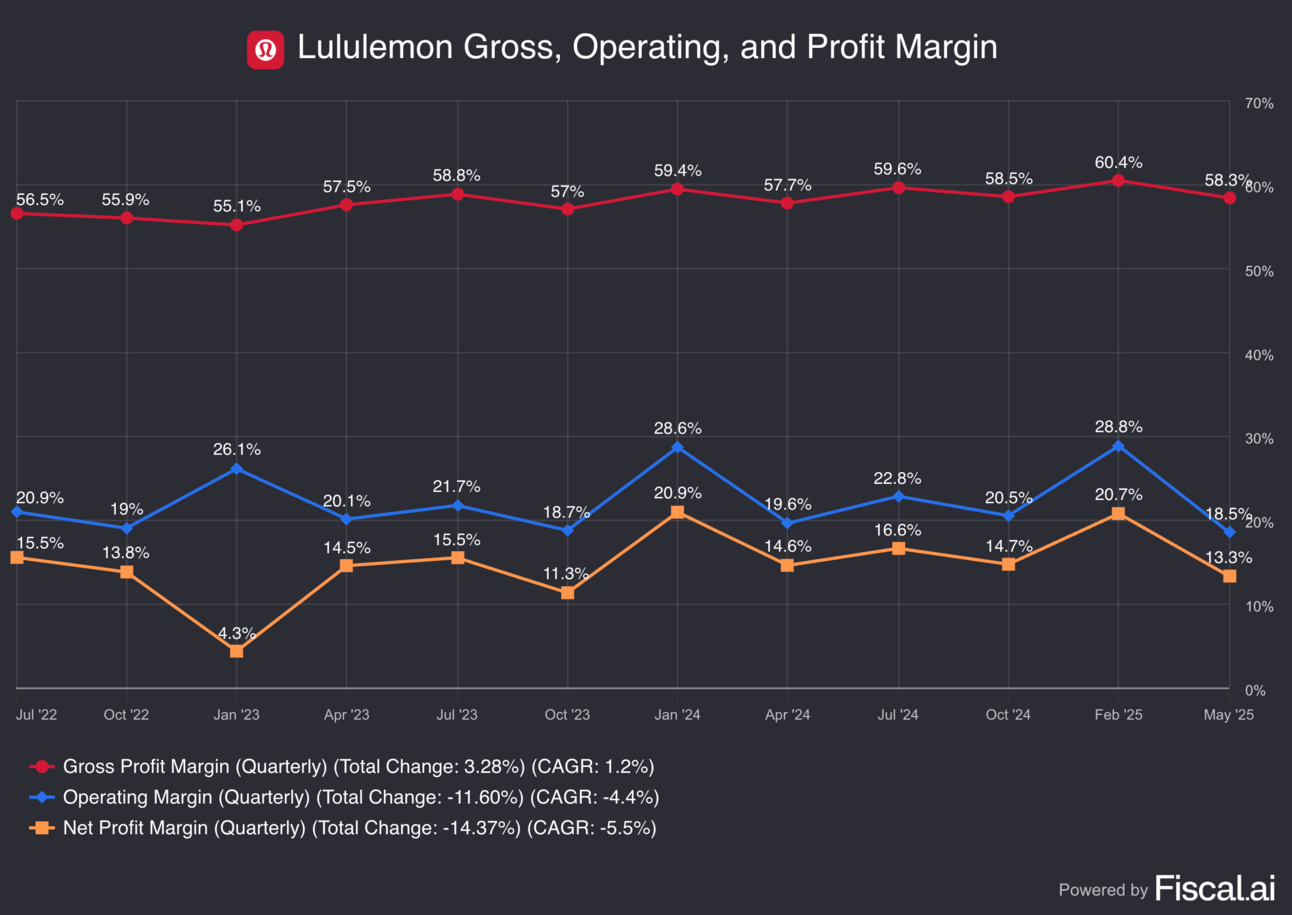
As a result, the company expects 2025 operating margins to decline 160 basis points.
Consumer demand is also under pressure.
U.S. retail sales have been mostly flat or negative this year.
May sales fell 0.9%, per U.S. Census data.
Additionally, U.S. consumer spending declined 0.3% in May.
This was the highest decline since the start of the year.
Interest rates remain high as well.
In its June meeting, the Fed held rates at 4.25%–4.5%, the highest level since 2007.
High borrowing costs and better savings returns continue to weigh on discretionary spending.
3/ Increased competition
Competition is intensifying across the board.
Brands like Vuori, Alo Yoga, Athleta, and Nike (via its Skims partnership) are gaining traction.
Even Costco’s Kirkland hoodies and joggers are a threat.
Lululemon recently sued over the similarity in design.
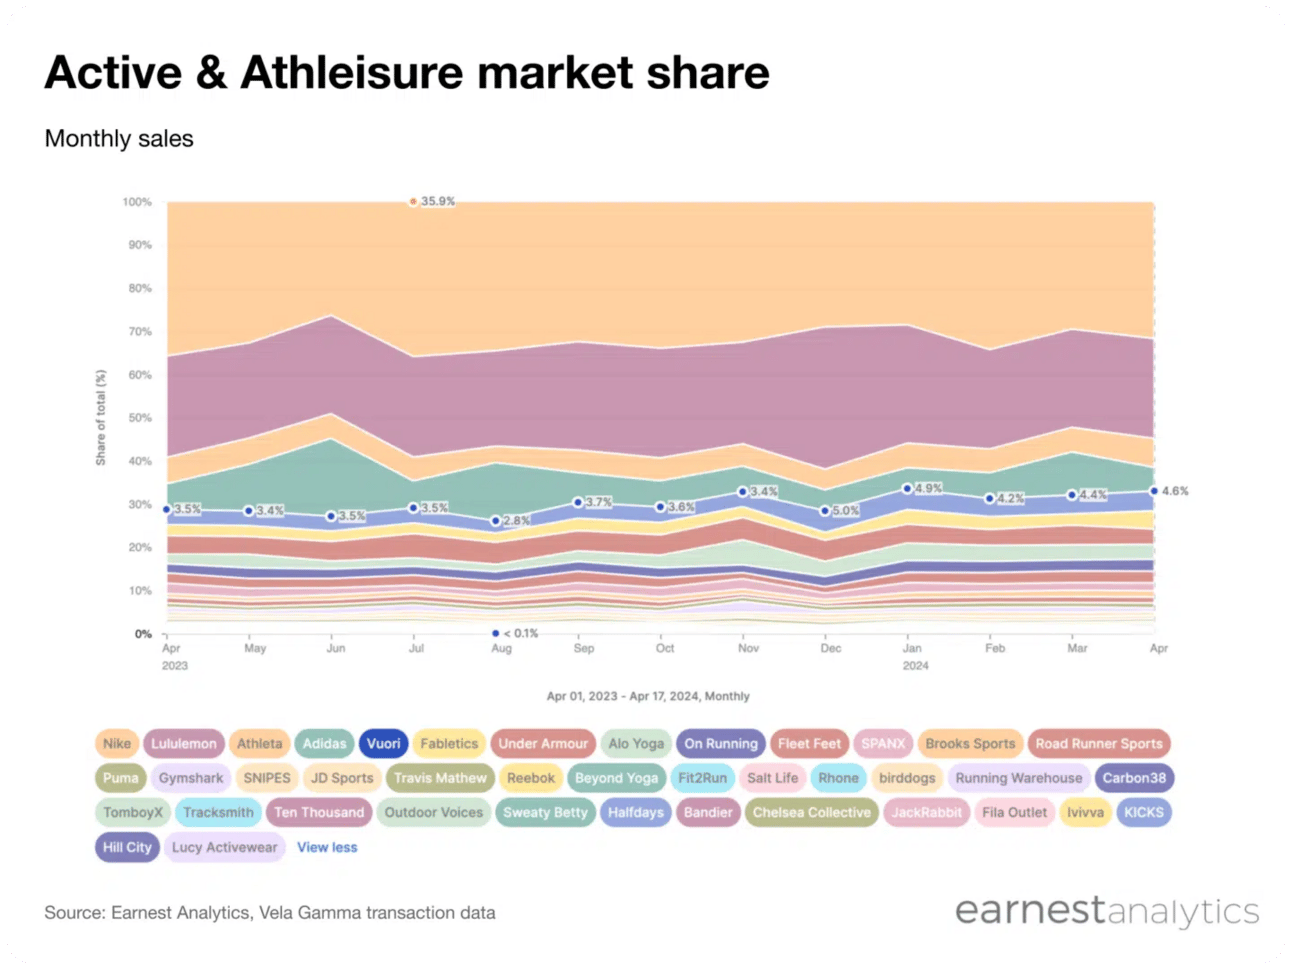
According to Earnest Analytics (April 2024):
Nike leads U.S. market share at 31.6%, followed by Lululemon at 21.2%.
Vuori and Alo are gaining ground, each adding 1% market share YoY.
Vuori shoppers grew their wallet share from 21.6% to 27.4%.
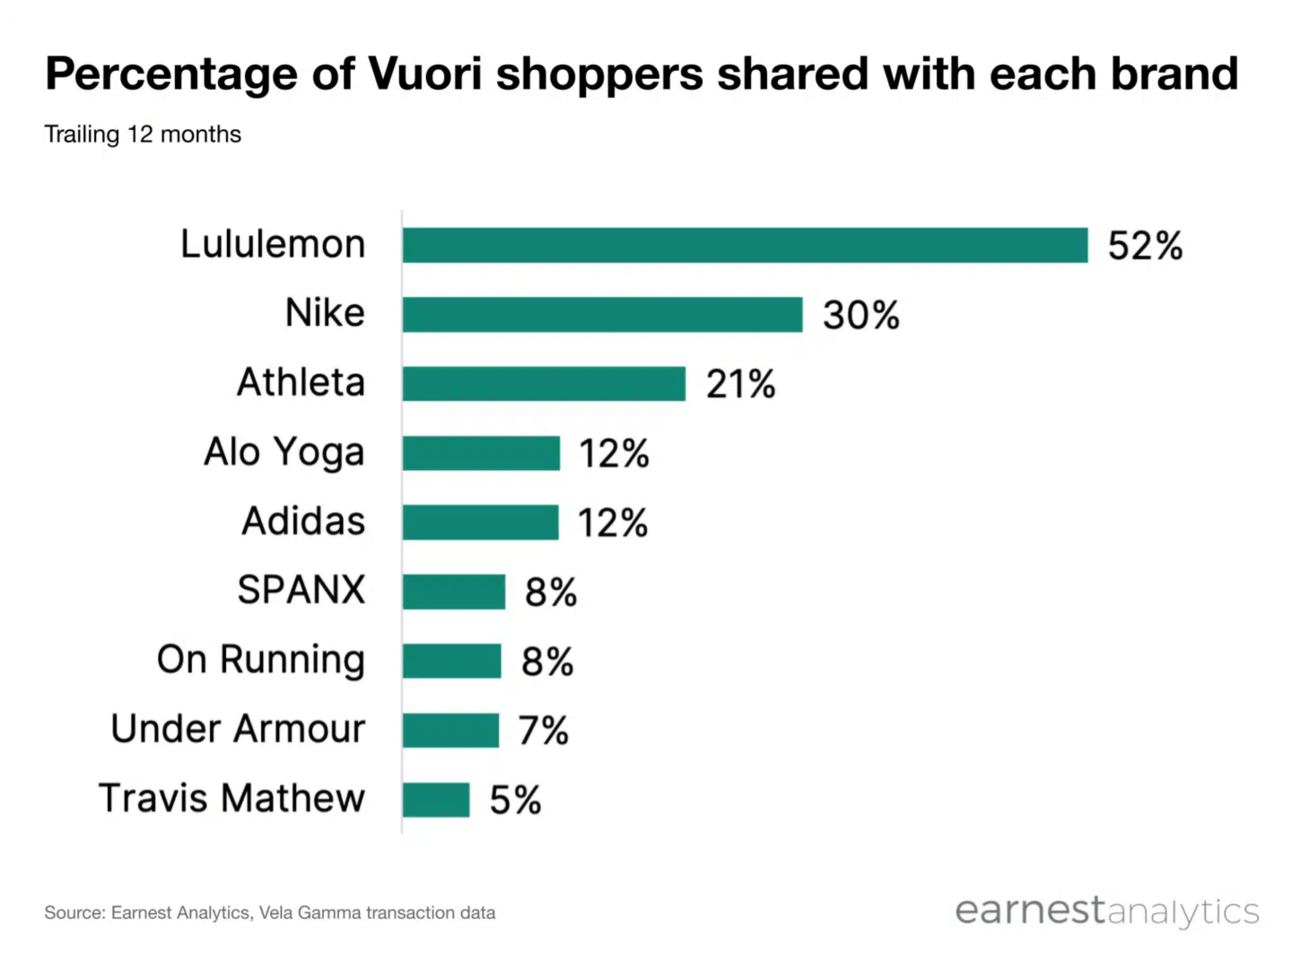
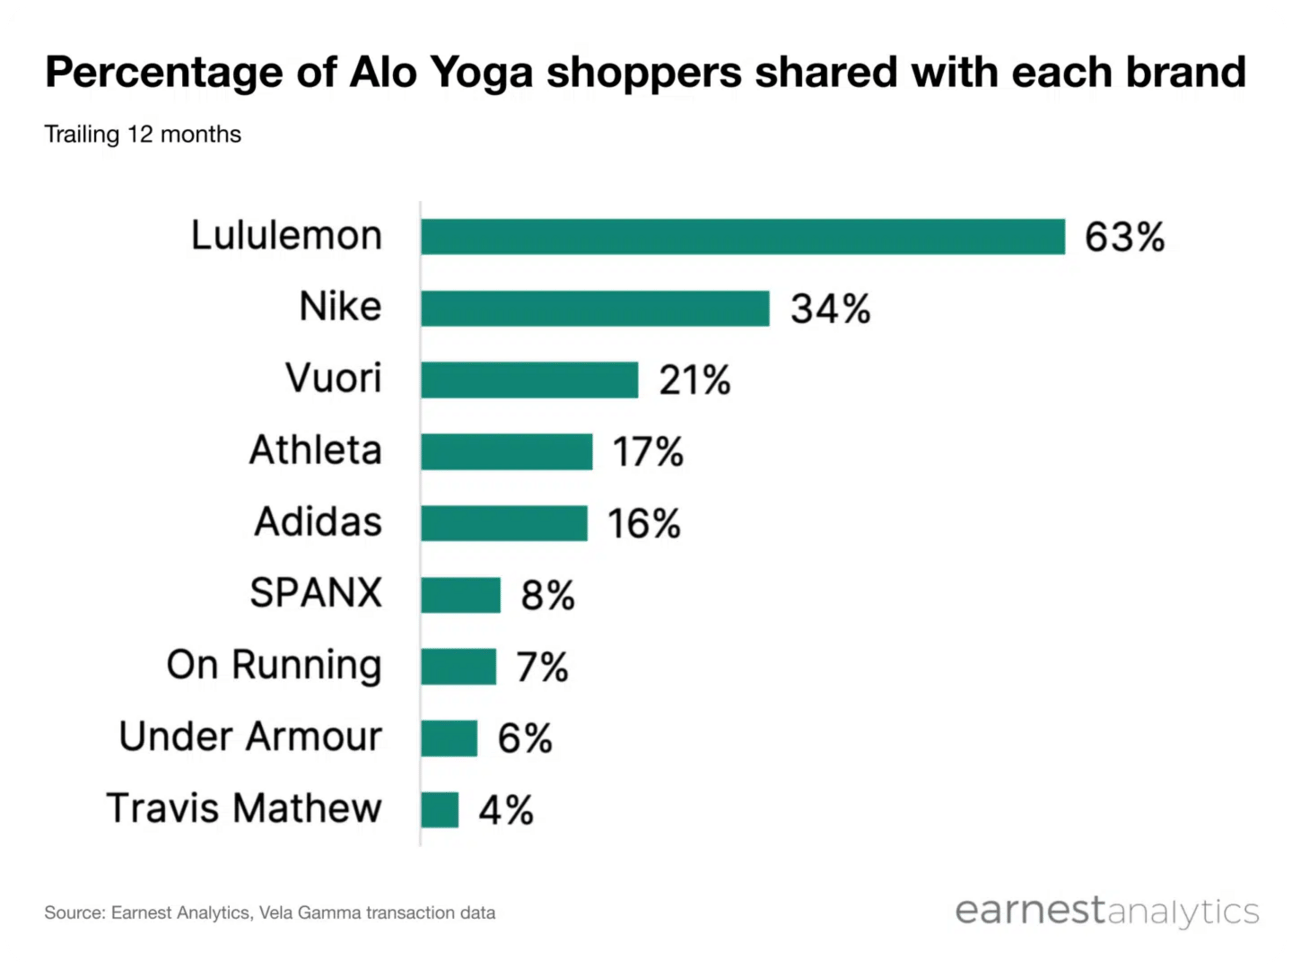
Notably, 52% of Vuori shoppers and 63% of Alo shoppers also shop at Lululemon, showing strong overlap and heightened competition for wallet share.
In the latest call, McDonald warned competitors could increase promotional activity in the second half of the year.
This may force Lululemon to lower prices, putting further pressure on margins and earnings.
4. Opportunity
Lululemon’s recent decline has been driven by softer consumer demand, macro headwinds, and rising competition.
But several factors suggest the selloff is near its peak, and reasons for long-term optimism remain.
1/ Industry-Wide Slowdown, Not Just Lululemon
The entire retail and discretionary sector has been under pressure, not just Lululemon.
As pointed previously, retail sales have been flat or negative, and discretionary spending has slowed broadly.
Major competitors are also feeling the pinch in the most recent quarter:
Nike: Revenue down 12%
Under Armour: Revenue down 11%
Athleta (Gap): Revenue down 6%
Despite this, Lululemon still posted high mid single-digit revenue growth, showing some level of resilience even as the market repositions from its previous high-growth expectations.
Importantly, Lululemon maintained its 2025 revenue guidance of 7–8% growth and even gained market share in both men’s and women’s premium activewear in the U.S. as per the most recent quarter.
Lululemon holds 21.2% U.S. market share
Vuori + Alo combined: only 4.2%
Vuori is often cited as a rising threat.
The company was most recently valued at $5.5B and is estimated to generate around $1B in annual revenue.
While Vuori’s growth is solid, it’s also expected given its smaller size, and not nearly as explosive as some make it out to be, especially when Lululemon continues to grow meaningfully off a much larger base.
Lululemon, Vuori, and Alo all have room to grow, largely by chipping away at Nike’s 31.6% share, or from other competitors.
Ultimately, product innovation and staying on-trend will be the biggest differentiators for any brand in the space.
2/ Tariff Relief Could Come Sooner Than Expected
The worst of the tariff risk may be behind us.
The Trump administration recently struck a deal with Vietnam, one of Lululemon’s largest production bases, setting tariffs at 20%.
This was far below the 46% initially proposed, and while final terms are pending, the progress offers optimism that overall impacts could be limited.
Vietnam has shown a willingness to negotiate quickly, and other countries may follow suit.
3/ Mitigation Strategies Are Underway
Lululemon is taking proactive steps to offset margin pressures:
Negotiating with vendors
Identifying supply chain efficiencies
Strategic, modest price increases
The company handled COVID-era disruptions well and appears prepared to move nimbly again.
CFO Meghan Frank emphasized price hikes would be limited and targeted, acknowledging their premium consumer can absorb some of the increase.
Management expects these efforts to be most impactful in the second half of 2025.
While these mitigation efforts won’t fully offset the headwinds, they should provide a meaningful buffer, one that many competitors likely can’t match.
4/ A Rising Tide Can Lift All Boats
The global athleisure market is projected to grow at a 9% CAGR, reaching $625B by 2029, according to Mordor Intelligence.
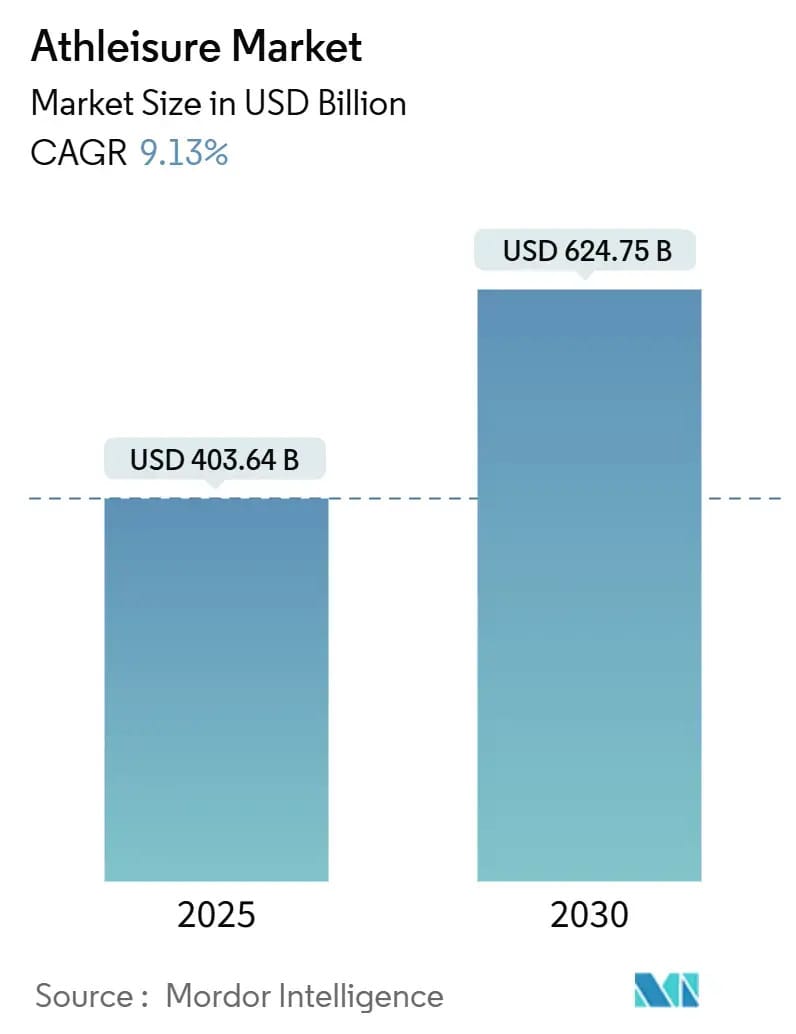
This isn’t a winner-take-all industry, multiple players can thrive.
Additionally, Nike, despite its Skims partnership, has faced delays launching its new activewear line.
Execution risk remains across all of its competitors, and Lululemon is still well-positioned within the premium technical apparel segment.
5/ Strong Financial Position
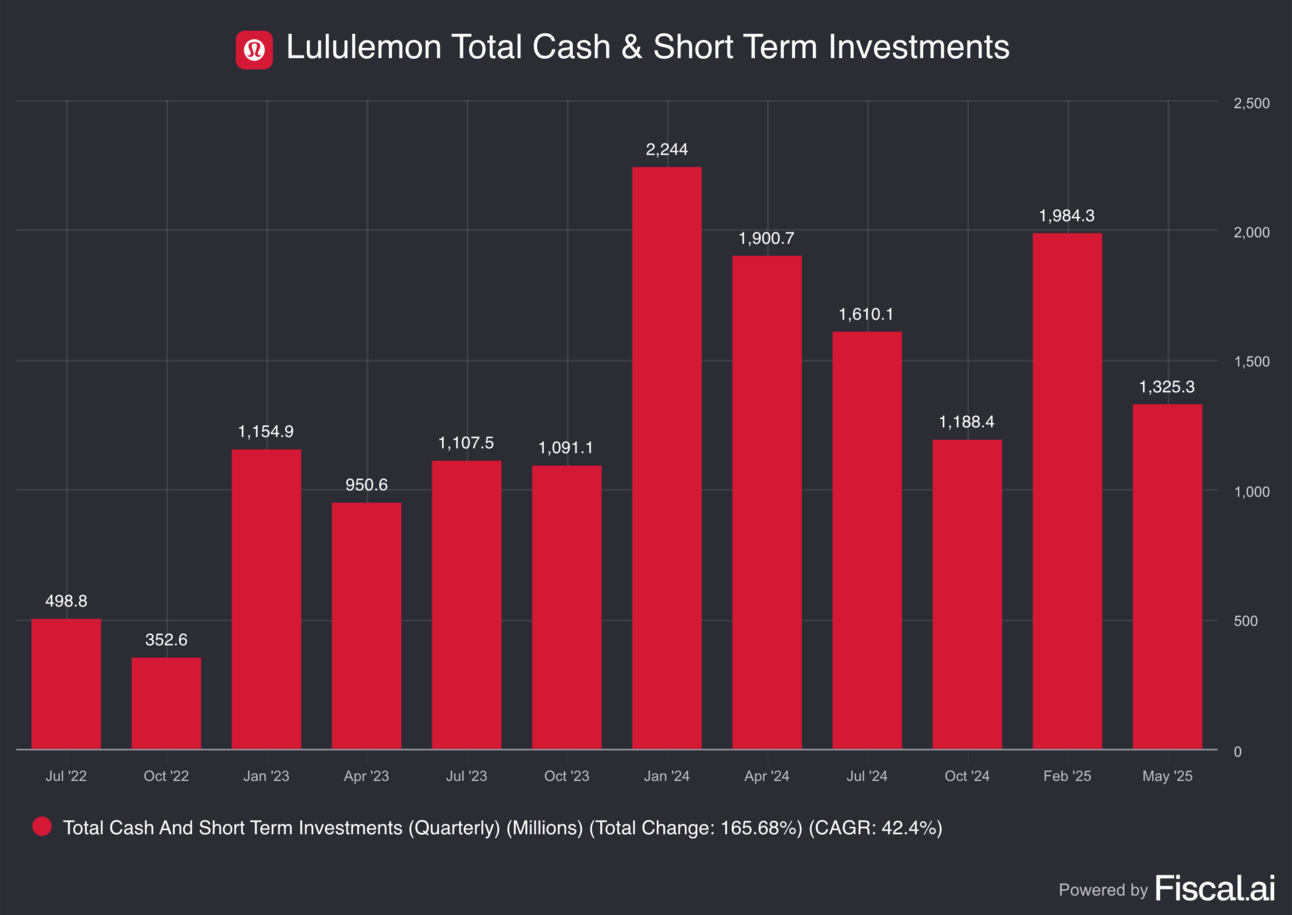
Lululemon has $1.3B in cash and no debt, giving it flexibility to:
Reinvest in innovation
Buyback shares
Acquire emerging brands
This financial strength is a major advantage in a tough macro environment.
6/ International Growth Remains Strong
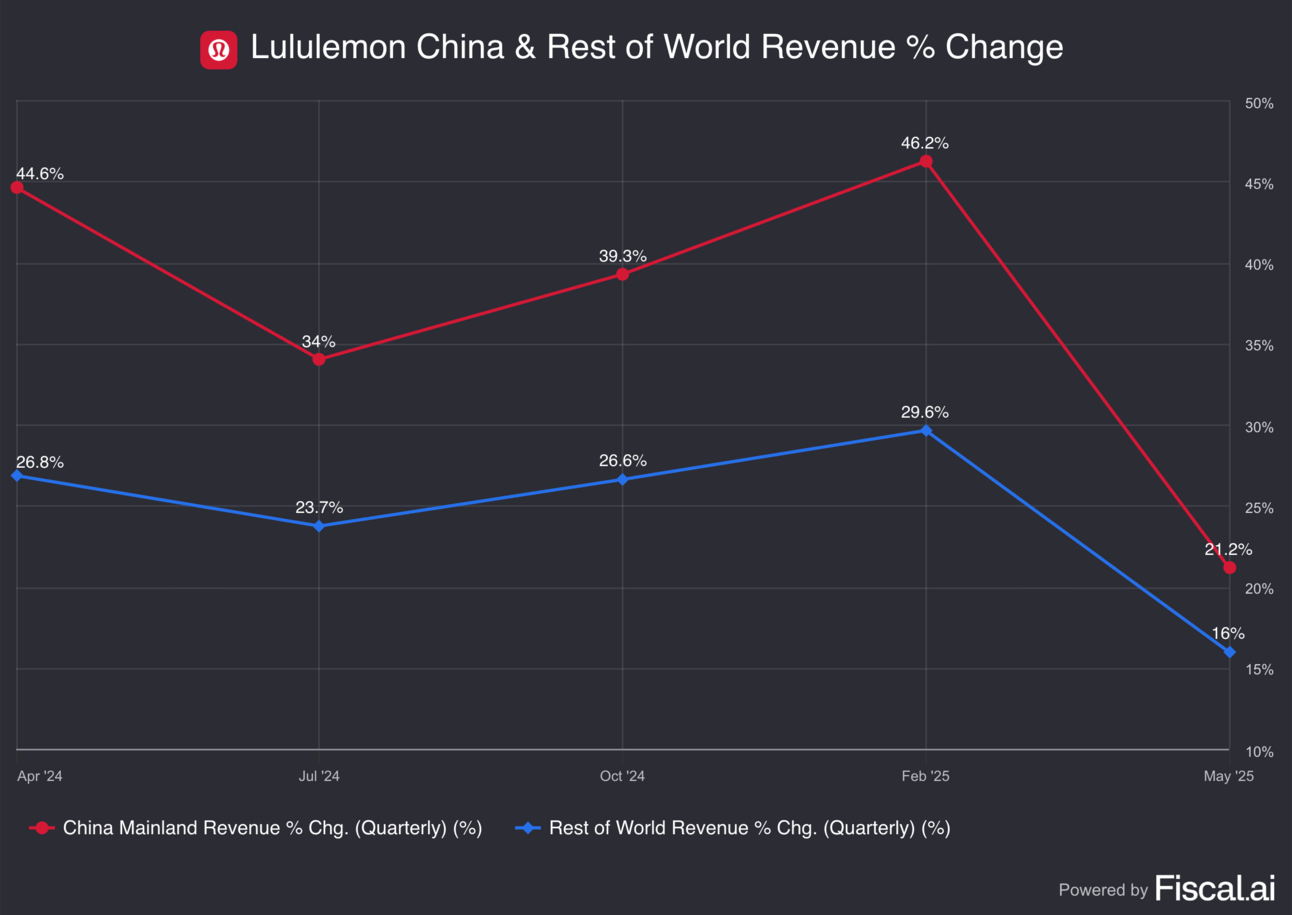
While North America growth has slowed, international markets continue to grow sales at high double digits in the most recent quarter:
China: +21% YoY
Rest of World: +16% YoY
Additionally, the company expects in full year 2025 for:
China to grow 25–30%
Rest of World to grow 20%
North America to remain in low-to-mid single digits
Today, just 25% of revenue is international.
Management sees potential for a 50/50 split, suggesting significant runway ahead.
7/ Store Expansion Advantage
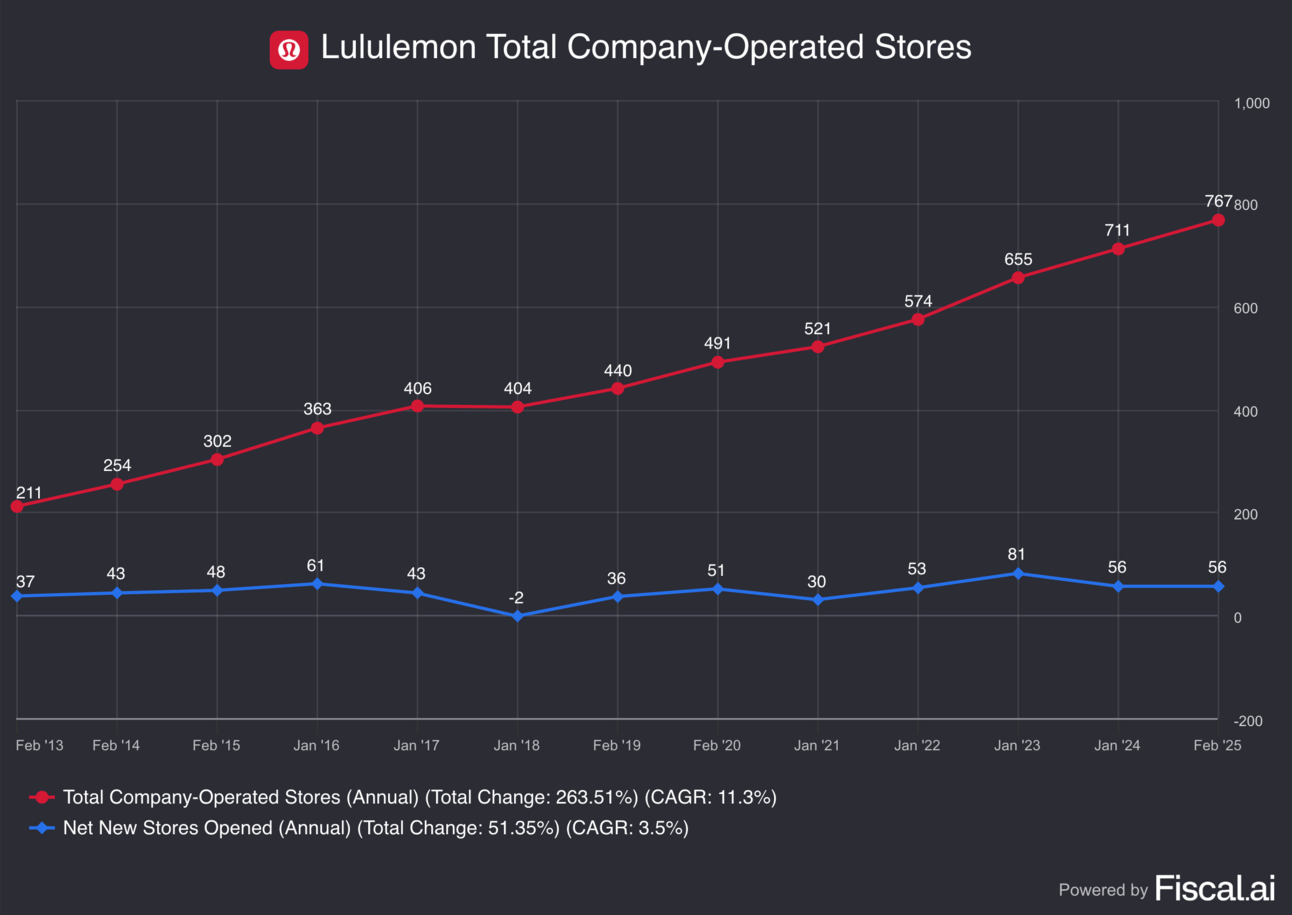
As of Q1 2025, Lululemon operates:
373 stores in the U.S.
154 in China
62 in Rest of World
770 total globally
In contrast (per Retail Touch Points):
Vuori: ~85 stores
Alo Yoga: ~126 stores
Lululemon’s broader global footprint gives it more room to scale, and more data to shape product innovation that can feed back into U.S. growth.
Management also highlighted that Lululemon’s premium positioning gives it stronger pricing power than fashion-oriented brands.
Demand for high-end luxury apparel (e.g., Louis Vuitton, Gucci) has also seen a dramatic slowdown.
Although their styles don’t directly overlap with Lululemon, consumers seeking premium quality at a more accessible price point may increasingly turn to Lululemon.
Lastly, as fitness and wellness trends grow globally, Lululemon remains in the right space to benefit from this.
8/ Rate Cuts Ahead
Interest rates remain at a 17-year high (4.25–4.5%), but the Fed has signaled two potential cuts in 2025.
Lower rates could ease pressure on consumers and reignite spending, especially in discretionary categories like apparel.
6. Moat & Management
1/ Competitive Advantage
Lululemon holds a narrow but durable moat, driven by first-mover advantage in the athleisure space, brand loyalty, and scale across North America.
As consumers often shop multiple brands, Lululemon benefits from being a go-to choice, with strong brand equity and deep integration into lifestyle and wellness culture.
Its early lead has enabled it to expand globally, turning its U.S. dominance into a potential worldwide footprint.
2/ Industry-Leading Capital Efficiency
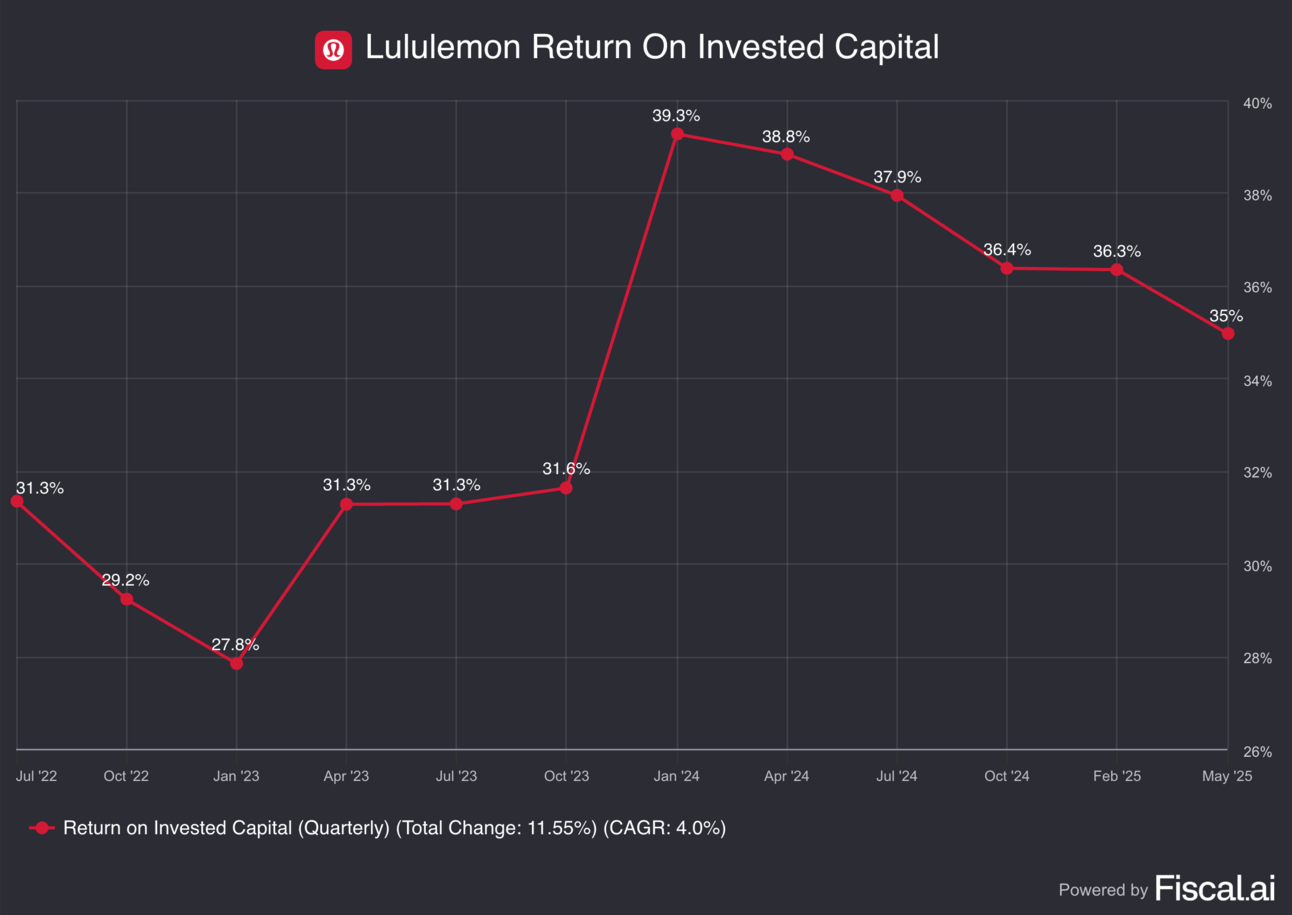
Lululemon consistently generates exceptional returns:
5Y Return on Invested Capital: 35%
5Y Return on Assets: 22%
5Y Return on Equity: 38%
These figures are well above industry norms, highlighting strong operating discipline and smart reinvestment.
This level of capital efficiency is a key differentiator.
3/ Experienced Leadership
Calvin McDonald (CEO) joined in 2018, bringing decades of retail experience from Sephora, Sears Canada, and Loblaw Companies.
Under his leadership, Lululemon has seen:
Revenue grow from $3.3B (2019) to $10.6B (2025)
Net income grow from $0.5B (2019) to $1.8B (2025)
Meghan Frank (CFO), with prior roles at Ross Stores and J.Crew, has played a critical role in preserving margins while supporting international expansion.
She helped steer the company through COVID with disciplined cost control and a focus on long-term growth.
Nikki Neuburger (Chief Brand Officer), formerly at Nike and Uber Eats, has helped to enhance Lululemon’s brand voice and community engagement, key pillars in a market where emotional brand connection drives loyalty.
4/ Shareholder Alignment Through Buybacks
Lululemon repurchased $1.7B of stock over the past year, around 6% of its current market cap.
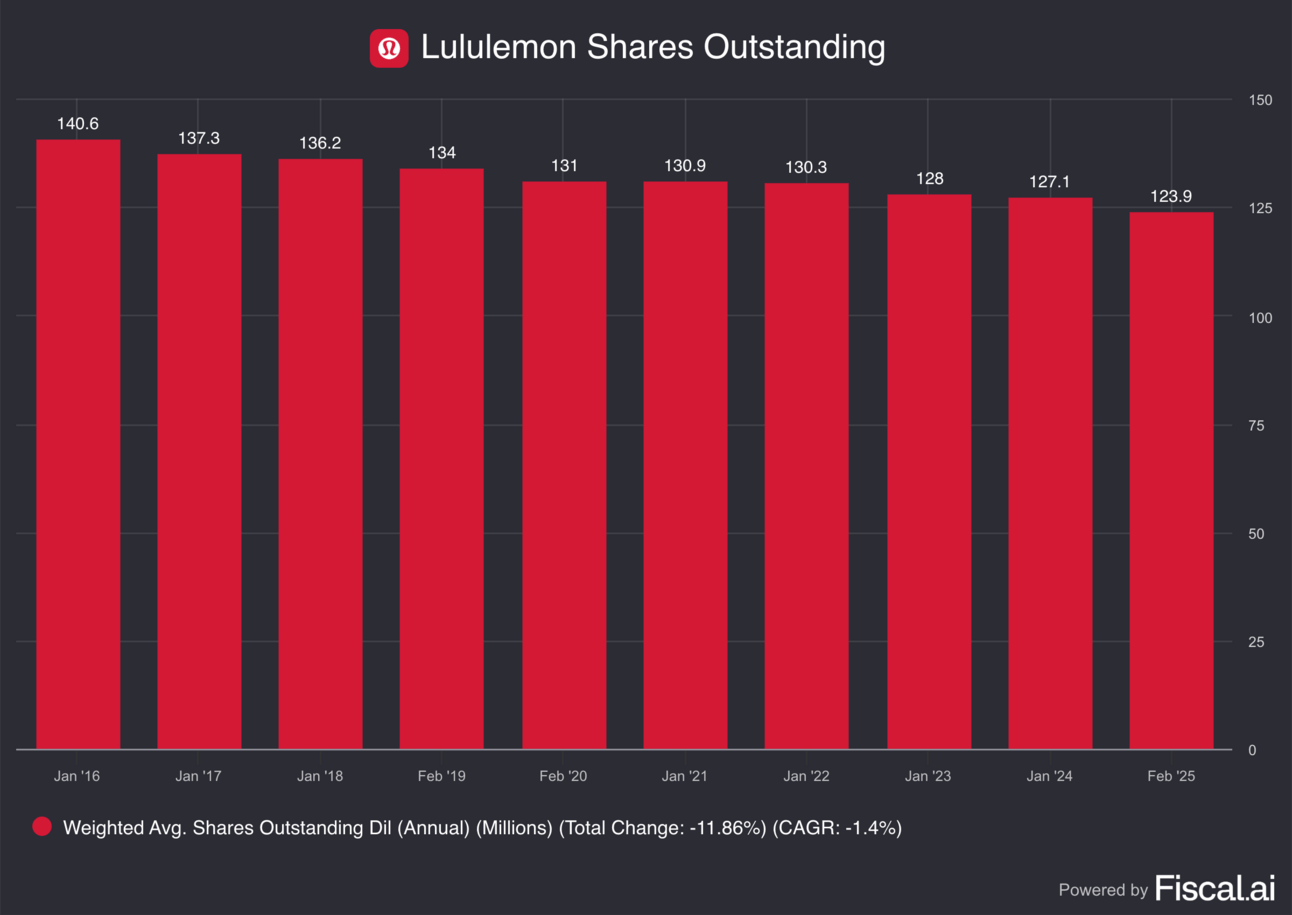
The company has a disciplined history of buybacks, which has steadily reduced share count and increased shareholder ownership.
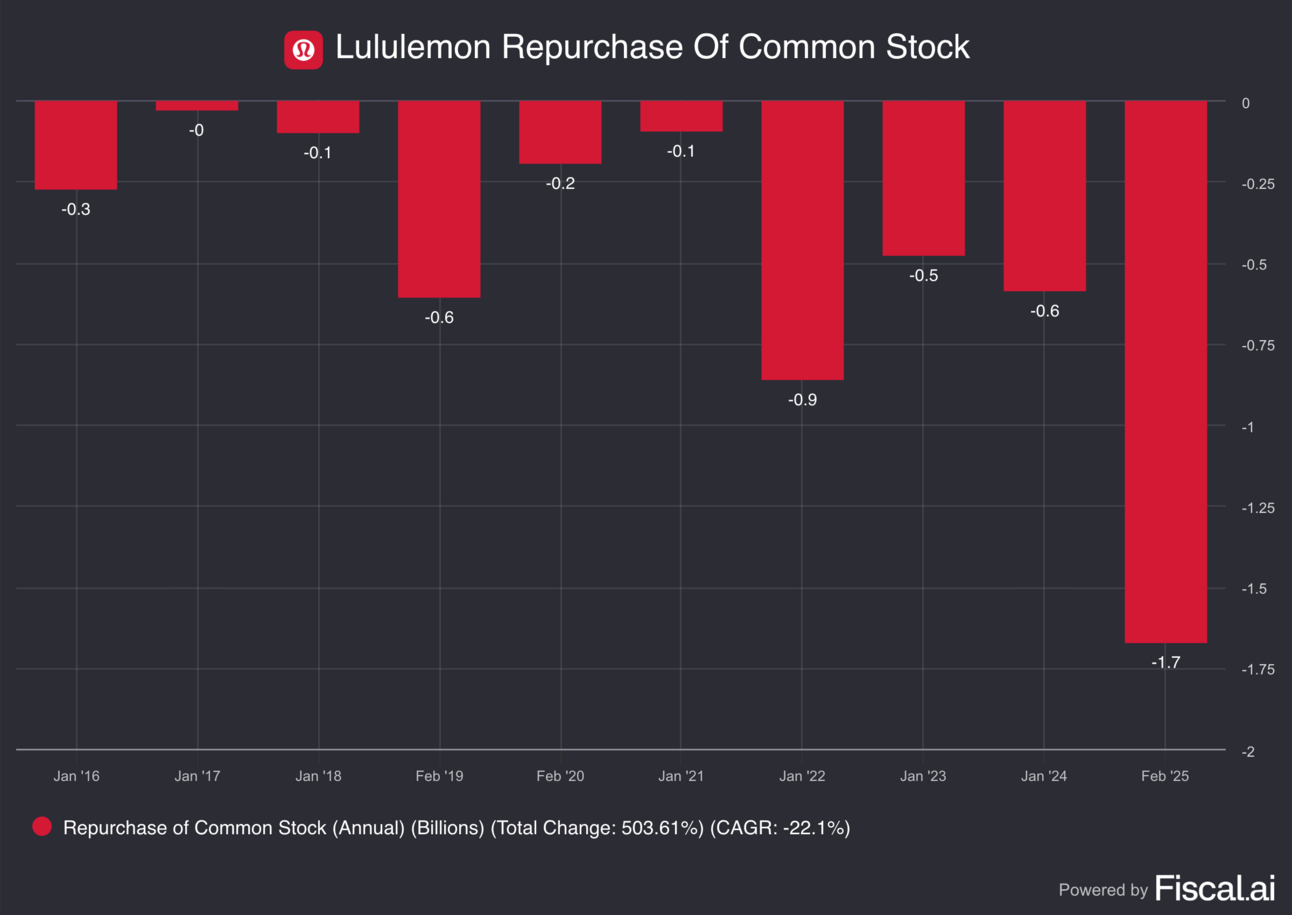
Importantly, during the company’s most recent earnings call, they indicated that FY25 EPS guidance excludes the benefit of future buybacks, meaning any continued repurchases could lead to upside surprises in earnings.
5/ Insider Activity: Quiet but Not Concerning
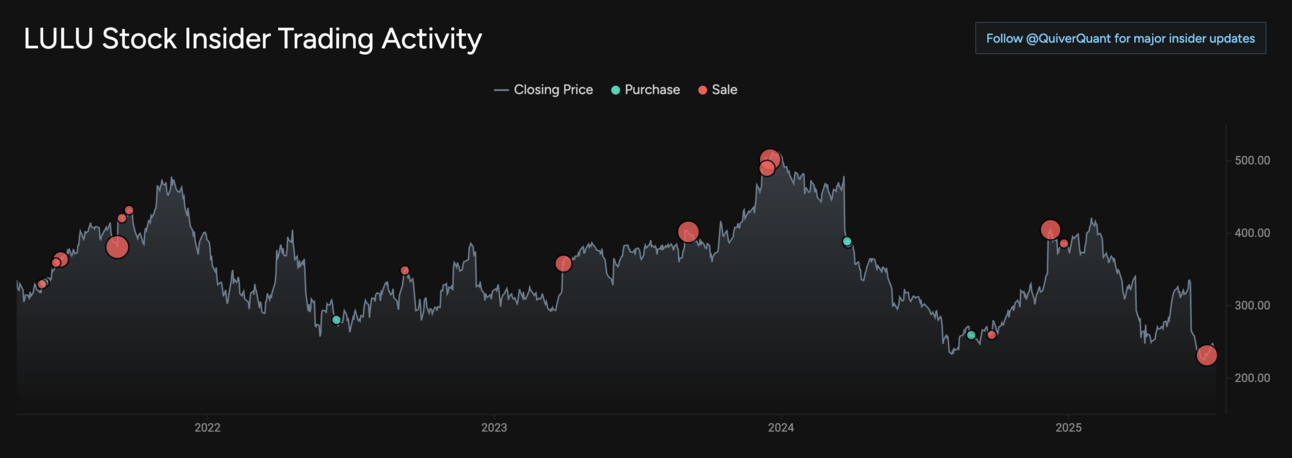
Insider trading has been minimal.
While there haven’t been any significant insider buys recently, CEO Calvin McDonald did sell 27,000 shares (~$6.4M) in a planned transaction tied to stock option exercises.
He still holds over 110,000 shares, signaling continued long-term alignment.
7. Risk Radar
Even great companies face long-term structural risks.
For Lululemon, these risks could weigh on growth, margins, and valuation if not properly addressed.
Here are four key risks that warrant investor attention:
1/ Brand Saturation in North America
Lululemon may be nearing peak brand penetration in its home markets.
With high store density and deep cultural reach in the U.S. and Canada, incremental growth is harder to come by.
The company must carefully manage store expansion to avoid market oversaturation, where returns on new locations begin to diminish.
Additionally, recent product missteps, like the withdrawal of its ‘Breezethrough’ leggings following customer complaints, highlight how quickly consumer perception can shift.
In fashion-forward sectors, trend fatigue and design misalignment can lead to immediate attrition.
2/ Narrow Product Focus
Lululemon still generates the bulk of its revenue from athleisure apparel.
While dominant in this niche, its limited category diversification poses risk.
Expansion into adjacent categories like footwear remains early-stage and highly competitive.
Nike and Adidas have decades of brand equity, athlete endorsements, and deep-rooted customer loyalty in shoes, making it difficult for new entrants to gain meaningful share.
If Lululemon fails to diversify successfully across various product lines, it could face a growth ceiling.
3/ Prolonged Macro Headwinds
If high interest rates, elevated tariffs, or weakened consumer spending persist longer than expected, Lululemon’s recovery in North America could stall.
Worse, if global macro conditions deteriorate, its growth engines in China and the rest of the world could slow as well.
This would weigh on revenue, compress margins, and potentially lead to further valuation compression.
While such broad weakness might not be company-specific, it could drag the stock down regardless of execution.
4/ Leadership Execution Risk
Lululemon’s financial efficiency is a strength, but not a guarantee.
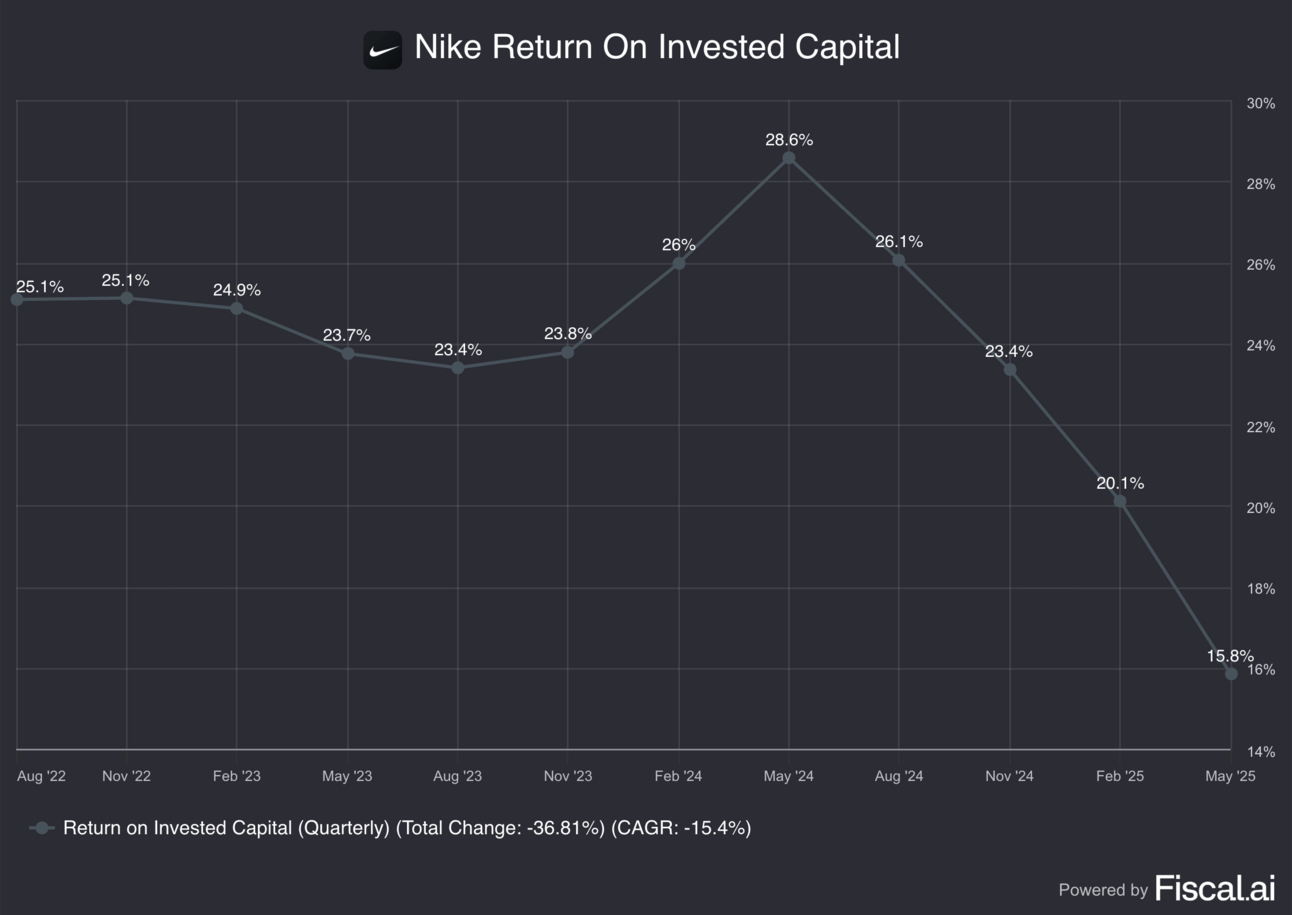
Look no further than Nike: the company once sustained 25%+ returns on invested capital, but that figure dropped to roughly 16% in its latest quarter.
Execution missteps, like the failed pivot away from wholesale partners, slower product cycles, and internal organizational complexity, have weighed on performance.
As Lululemon scales, it must maintain organizational agility, stay ahead of trends, and make disciplined capital decisions.
Losing this edge could erode its margin profile and narrow moat.
8. Valuation
Lululemon looks undervalued across multiple metrics, both relative to its history and its fundamentals.
1/ Forward PE vs Historical Median
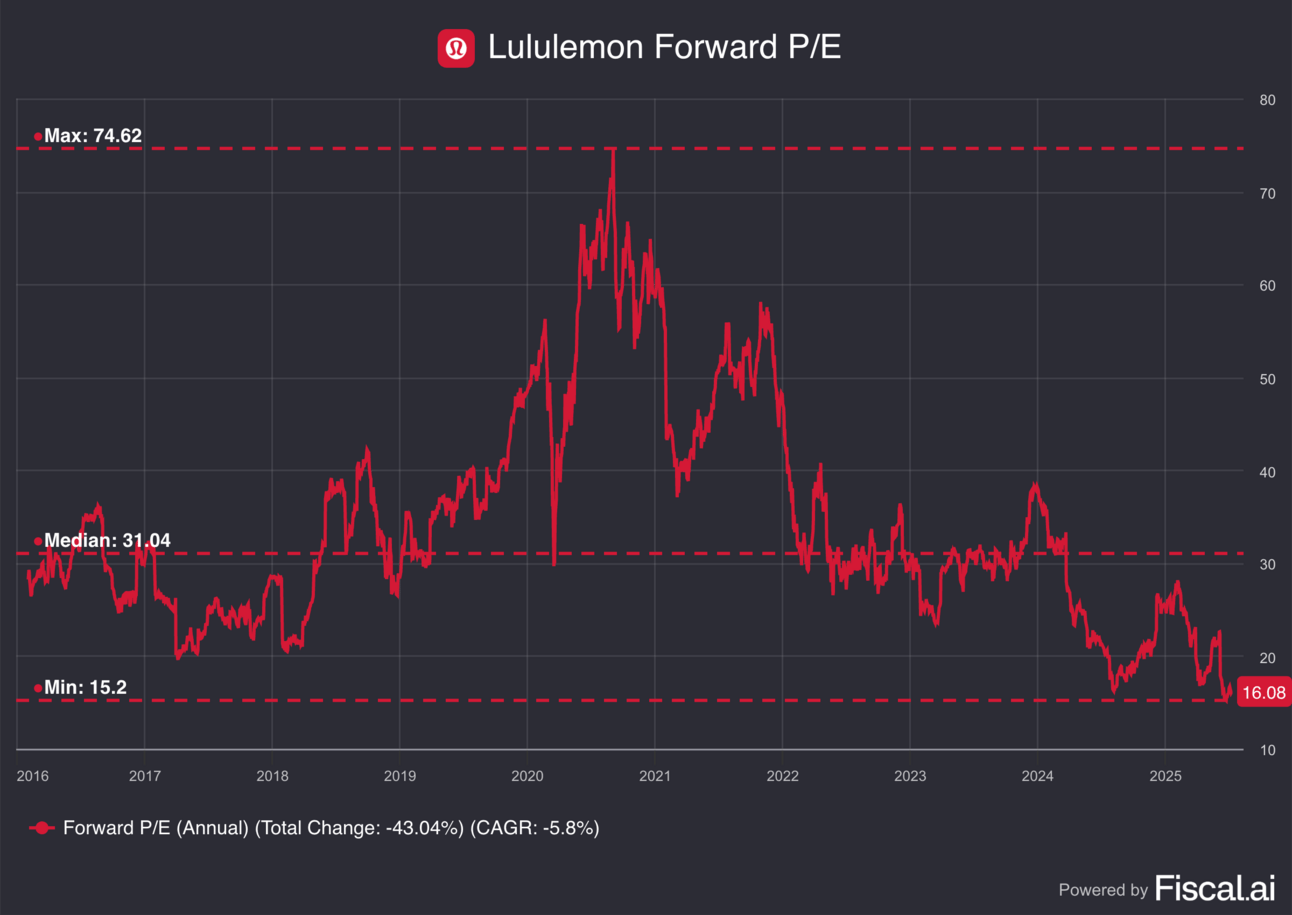
Lululemon currently trades at just 16x forward earnings, a sharp 48% discount to its historical median of 31x.
This is near the lowest valuation the stock has seen in the past decade.
Even a modest rerating to 20x would imply 25% upside, assuming earnings stay constant.
The stock also trades at a 30% discount to the S&P 500’s forward P/E of 23x, a rarity for a high-quality consumer brand.
Lululemon has historically traded at an exorbitant valuation, but today’s pricing reflects a far more reasonable risk/reward profile.
2/ Discounted Cash Flow
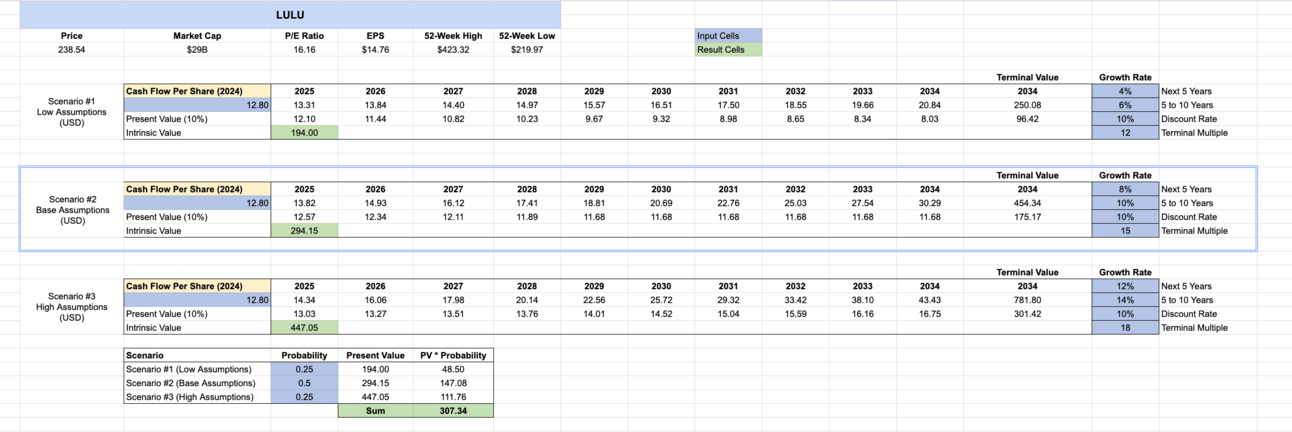
While DCFs involve uncertainty, they provide a useful lens for long-term value.
Using conservative assumptions to maintain a margin of safety, the analysis suggests Lululemon is trading at a 30% discount to its intrinsic value.
Fair Value Estimate: $307
Current Price: $237
Implied Upside: +30%
9. Final Take
Lululemon now trades at a reasonable valuation, with a margin of safety baked in based on both conservative DCF estimates and historical multiples.
While growth has clearly slowed, the evidence suggests this deceleration is more cyclical than structural.
Competitive threats are real, but fears of Lululemon losing significant share appear overstated, especially given its strong brand, financials, and market position.
At today’s price, Lululemon offers investors the chance to own a high-quality business at a fair price.
It’s not a deep value play, but for long-term holders, it could be an attractive entry point.
I don’t currently own shares, but would consider starting a small position if it drops below $220 again.
Should macro headwinds intensify and the stock retest Covid-era lows near $180, that could present a compelling long-term opportunity, assuming the decline remains macro-driven rather than company-specific.
Disclaimer
This report is for informational and educational purposes only and does not constitute financial, investment, tax, legal, or other professional advice. The content provided herein is based on publicly available information and independent research at the time of publication and may not be accurate, complete, or up-to-date. No guarantees are made regarding the accuracy or completeness of the information or analysis provided.
Any opinions expressed are solely those of the author and do not represent the opinions or views of any past, present, or future employers. The author is not a licensed financial advisor, broker-dealer, or tax professional. Readers are strongly advised to conduct their own due diligence and consult with qualified professionals before making any financial, investment, or legal decisions.
You should assume that, as of the publication date of this report or any communication referencing publicly traded securities or assets, the author may have a position in the securities or assets mentioned and may stand to realize significant gains if the price moves. Following publication, the author may continue transacting in the securities discussed and may be long, short, or neutral at any time thereafter, regardless of the initial position. The author reserves the right to alter any position at any time without notice.
There is no obligation to update any information after publication. The author and affiliated parties are not responsible for any changes in market conditions, economic shifts, or new developments that may impact the accuracy of the content.
Forward-Looking Statements
This report may contain forward-looking statements, including but not limited to projections, estimates, and expectations regarding financial performance, market trends, and future company developments. These statements are based on assumptions that may prove incorrect, and actual results may differ materially. The author assumes no responsibility for updating forward-looking statements in light of new information or future events.
Third-Party Data & External Sources
This report may rely on data from third-party sources believed to be reliable. However, the accuracy, completeness, or timeliness of such data cannot be guaranteed. The author assumes no liability for errors, omissions, or inaccuracies in third-party data and does not endorse or take responsibility for the methodologies used by these external sources.
AI-Generated Enhancements
This report has been optimized using AI for clarity and conciseness. AI was primarily to improve readability and structure.
Confidentiality & Redistribution
Readers are welcome to share this report with others; however, copying, reproducing, republishing, or modifying its content in any form without prior written permission is strictly prohibited.
Investment Risk Disclosure
Investing involves risks, including the loss of principal. Past performance is not indicative of future results. The mention of any securities, companies, or investment strategies does not constitute an endorsement or recommendation. Any reliance placed on the information in this report is strictly at the reader’s own risk.
The author and affiliated parties shall not be held liable for any direct, indirect, incidental, consequential, or other damages arising out of the use of this report or any reliance on the information provided. By accessing this report, you agree to indemnify and hold harmless the author and affiliated parties from any claims, liabilities, or damages resulting from your use of the content.
You are solely responsible for your own decisions. Proceed at your own risk.
Reply